Meta Ads Manager puts a number from 0 to 100 at the top of every ad account: opportunity score. It looks like a grade for the agency's work, and clients who log in notice it. But Meta is clear that the score counts how many of its recommendations you have applied. It is not a measure of results, and a client who reads it as one will judge the account on the wrong number.
This guide explains what the score measures, what Meta changed in March 2026, and how to turn each recommendation into Facebook ads optimization a client can follow: the change, plus the Ads Manager number that shows whether it worked.
Key takeaways
Opportunity score is based on how many Ads Manager recommendations you apply. Meta says it does not reflect actual or future performance.
Since March 2026, tools built on Meta's Marketing API can apply 14 recommendation types directly, so scores can rise without anyone opening Ads Manager.
Meta flags creative fatigue when an ad's cost per result reaches twice that of your past ads.
Switching off the "expensive" placement can reduce total results. Meta's own example shows it.
Lead with results and cost per result, or purchase ROAS. The score belongs in the notes, not the headline.
What does Meta's opportunity score measure?
Opportunity score measures how many of Meta's Ads Manager recommendations an account has applied, on a scale of 0 to 100, weighted by how much Meta thinks each one is worth. Meta's help page on opportunity score says the point value of each recommendation depends on the business type, campaign objective, budget allocation and the results seen for that recommendation in Meta's experiments.
Meta's own example shows how it adds up. An account at 60 could reach 100 by fixing audience fragmentation (worth 35 points) and turning on Advantage+ placements (worth 5). Two details matter for agencies. Dismissing a recommendation leaves the score unchanged, so an account that cannot apply some advice for business reasons will always sit below 100. And the score moves when Meta finds new recommendations, even if nobody touched the campaigns.
The recommendations fall into seven groups: automated campaigns, objective and goals, audience, creative and placements, signals, budget and bidding, and other errors or warnings. That list is useful, because each group maps onto a kind of Facebook ads optimization work with its own proof.
Does a higher opportunity score mean better results?
No. Meta says opportunity score does not reflect actual or future performance, even when the score is high, and that applied recommendations may help over time but are not guaranteed to. Its developer blog puts it in one line: the score "does not reflect or guarantee your actual or future performance."
Meta goes further than most vendors would. Its help page tells advertisers not to turn off campaigns with a low opportunity score, because the score shows how optimized a campaign is, not whether it is performing poorly, and says performance should be judged against business goals. That is the sentence to quote when a client asks why their score is 72.
In March 2026 Meta expanded "Apply via API" to 14 recommendation types, so third-party tools can now apply recommendations such as Advantage+ Audience and Creative Fatigue without the advertiser opening Ads Manager. The change was added as an update to Meta's November 2025 developer post, which had already raised the number of recommendations readable through the API from 14 to over 40.
For agencies this cuts both ways. Applying advice in bulk is faster. It also means an account's score can jump in an afternoon because a tool accepted a batch of suggestions, and nobody can say afterwards which of them helped. Meta also notes that recommendations in the API and in Ads Manager may differ. The fix is old-fashioned: log every applied recommendation with its date, and attach the number it was supposed to move.
How do you prove each Facebook ads optimization worked?
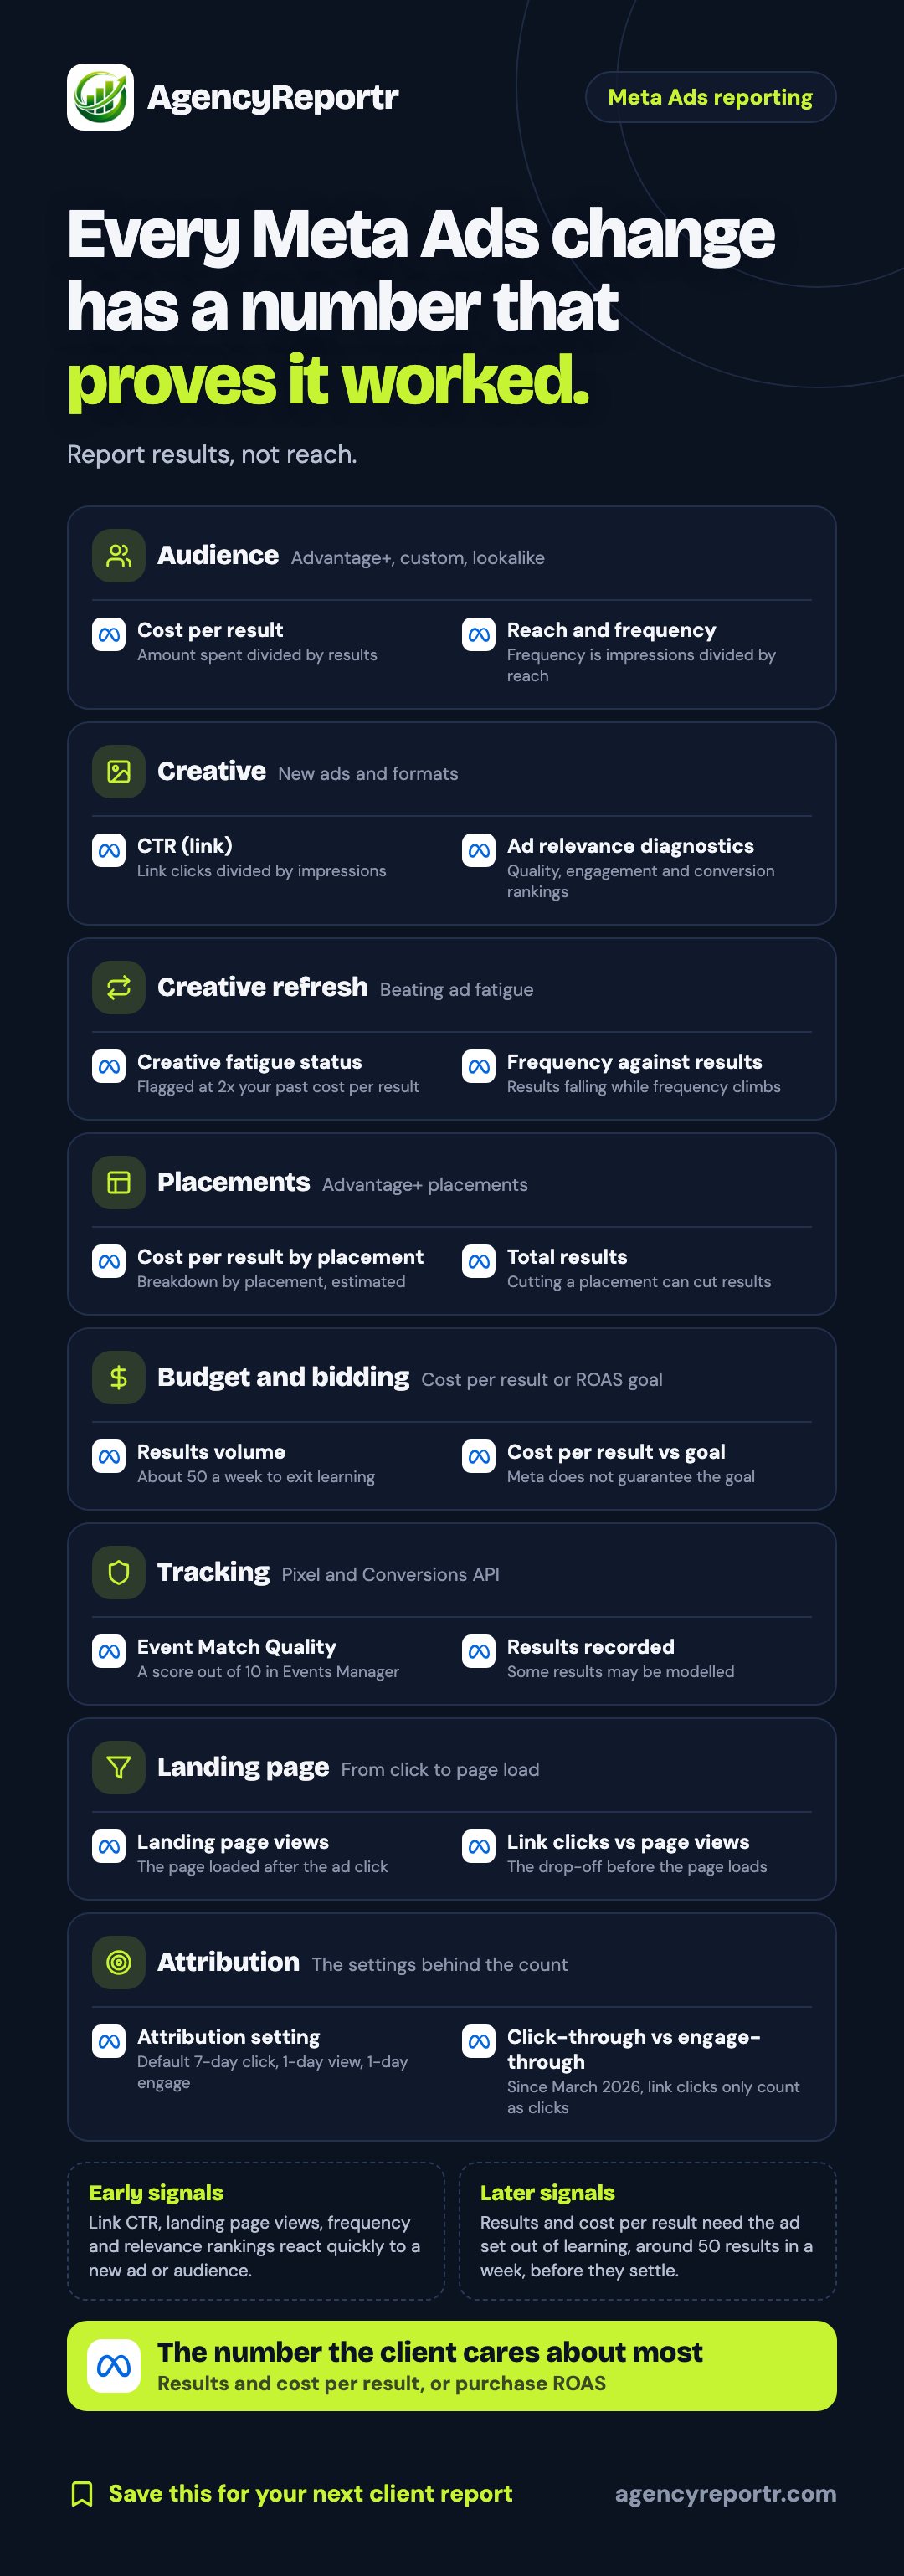
Prove each change with the Ads Manager number it was meant to move, shown before and after, never with the score. Here is the full map: eight kinds of Meta Ads work, two proof metrics each, and what Meta says they mean.
Save it for your next client report.
Recommendation or work
The number that proves it
Audience: Advantage+ audience, fragmentation
Cost per result (amount spent divided by results), with reach and frequency (impressions divided by reach) explaining the move.
New creative
CTR (link), link clicks divided by impressions, and the three ad relevance diagnostics: quality, engagement rate and conversion rate rankings.
Creative fatigue
The Creative fatigue status clearing, and cost per result falling after the new image or video goes live.
Advantage+ placements
Total results and overall cost per result for the ad set, not each placement alone.
Budget and bidding: scale a campaign, cost per result goal
Results volume once the ad set leaves learning, and cost per result against the goal.
Signals: Conversions API
Event Match Quality, a score from 0 to 10 in Events Manager, and more results recorded.
Landing page
Landing page views against link clicks: the gap is people who left before the page loaded.
Attribution setting
Which window and actions the results count, stated next to the results.
Three of these deserve a closer look. On creative fatigue, Meta's creative fatigue page says the Delivery column shows Creative limited when cost per result is above your past ads but under twice as much, and Creative fatigue at twice or more. Meta also says keeping the original ad running, rather than pausing it, may maximize results, so the proof is the ad set's cost per result, not the old ad's. On relevance diagnostics, Meta does not show them for ads with fewer than 500 impressions, and they are not inputs into the auction: they explain an ad's performance, they do not cause it. On budget and bidding, Meta says plainly that adherence to a cost per result goal or ROAS goal is not guaranteed.
Should you turn off the placement with the highest cost per result?
Usually not, because the placement that looks expensive can still be lowering the ad set's total cost. Meta's page on how delivery works with Advantage+ placements walks through an example. With Facebook, Instagram and Audience Network all on, an ad set got 9 results for $27, $3 each. Turn off Instagram because it averaged $5, and the same ad set got 8 results for $26, at $3.25 each.
The system buys the cheapest results available across every placement, not the cheapest average per placement. So for Facebook ads optimization the proof of placement work is total results and overall cost per result. Add a footnote too: Meta's Marketing API documentation says insights breakdown values, placement included, are estimated.
When can you judge a change, and what counts as a result?
Judge a change after the ad set leaves learning, which Meta says usually happens after about 50 results in the week after the last significant edit. Ads Manager has a Last significant edit column for exactly this. During learning, Meta says ad sets are less stable and usually have a higher CPA. An applied recommendation is still an edit, and edits that meaningfully change how an ad set might perform can send it back into learning.
Then say what a result is. Meta's default attribution setting is 7-day click, 1-day view and 1-day engagement, and some results may be modelled where data is missing. Since March 2026, Meta counts only link clicks as click-through for website and in-store conversions; other clicks, and video plays of 5 seconds, fall under engage-through. Click-through results can look lower than last year without the campaigns getting worse. Our post on the link-click attribution change covers how to explain that drop.
Early signals react within days of a change: link CTR, landing page views, frequency and the relevance rankings. Results and cost per result settle later. Report both, in that order of importance.
What should the client report show instead of the score?
The report should open with results and cost per result, or purchase ROAS for ecommerce, because that is what the client is paying for. Reach is not the result. Below that, list each recommendation the agency applied that month, the date, and the number it was meant to move, before and after. Recommendations the agency dismissed deserve a line too, with the business reason, so a score below 100 reads as a decision rather than neglect.
AgencyReportr builds a branded Meta Ads report for Facebook and Instagram with results, cost per result, delivery, placements, audience and creatives, opened by an AI-written summary. Start with a $1 trial.
Does a higher opportunity score improve Facebook ads results?
Not by itself. Meta says opportunity score does not reflect actual or future performance, even when it is high. Applied recommendations can help over time, but that is not guaranteed, so judge each one on results and cost per result.
How is Meta's opportunity score calculated?
It runs from 0 to 100 and is based on how many Ads Manager recommendations you apply, each weighted by its estimated value for your account. Dismissing a recommendation does not change the score, so an account that cannot apply some recommendations will always score below 100.
Should I turn off the placement with the highest cost per result?
Not automatically. In Meta's own example an ad set got 9 results at $3 each with all placements, and 8 results at $3.25 each after the more expensive placement was switched off. Judge the ad set's total results, not each placement on its own.
How does Meta decide an ad has creative fatigue?
Ads Manager shows Creative limited when an ad's cost per result is higher than your past ads but under twice as high, and Creative fatigue when it reaches twice as high or more. The fix Meta recommends is a materially different image or video.
How many results does an ad set need to leave the learning phase?
Meta says ad sets usually exit learning after about 50 results in the week after the last significant edit. Judge cost per result after that, not during learning.

 SEO Reporting ToolRankings, traffic & site audits
 SEO Rank Tracking ToolKeyword positions from Google
 Google Ads Reporting ToolSpend, ROAS & conversions
 Meta (FB) Ads Reporting ToolFacebook & Instagram campaigns
 LinkedIn Ads Reporting ToolLeads, cost per lead & campaigns
 Amazon Ads Reporting ToolSponsored Products, Brands & Display
 Social Media Reporting ToolInstagram, Facebook, YouTube & LinkedIn
 Google Business Profile ToolLocal visibility, reviews & calls
 YouTube Reporting ToolViews, watch time & top videos
 AI Visibility Tracking Tool NewChatGPT, Perplexity & AI Overviews
 White-Label Reporting ToolYour brand on every report
 Automated PDF ReportsScheduled delivery to every client